

Annual Revenue Projections by LTL Fleet Performance
The Less-than-truckload (LTL) freight industry in North America has 1.8 million registered trucking companies with over 200 consolidated carriers. The number of terminal depots is higher than 3300 active service centers which in turn deploy an overall dedicated fleet of approximately 120,000 to 160,000 lift trucks. The total revenue generated by LTL and its impact on the North American economy is expected to reach 120.5 billion by 2030. The LTL carrier business is the true driver of the North American economy with its critical backbone position. One factor that remains constant in this growing industry is that 50% of all Bills of Lading (BOL) submitted by customers contains inaccurate weights or product description. The following case study along with a cost benefit analysis is an LTL sector study that uses actual data from a cross sample of several carriers to identify a common area of improvement.
Analysis of LTL Weight Discrepancies and AuditMetrics Strategic Takeaways for Logistics Managers
In the less-than-truckload (LTL) freight industry, carriers flag weight discrepancies on approximately 39% of all tendered shipments, with the vast majority of these under- declarations freight weight working in the shipper's favour (under declared weight). Because the industry historically operated on an honour system, broader freight data indicates that roughly 50% of all Bills of Lading (BOLs) submitted by customers contain inaccurate weights or product descriptions.
Key Industry Metrics Summary
The deployment of automated technology across modern freight terminals has transformed how carriers catch under declared freight:
- 70% to 80% Audit Coverage: Most major LTL carriers now run 70–80% of all dock freight through automated dimensions and forklift / floor scales.
- 25% Re-rate Risk for Shippers: Case studies from major logistics reviews show that un-optimized shippers typically see up to 25% of their total shipments hit with an invoice adjustment (re-weigh or reclassification) before auditing their data internally.
- Standard Tolerances: Most carriers will allow a minor variance of 200 lb or 5% of the total declared weight (whichever is smaller) before triggering a formal Weight & Inspection (W&I) correction fee and a retroactive freight rate adjustment.
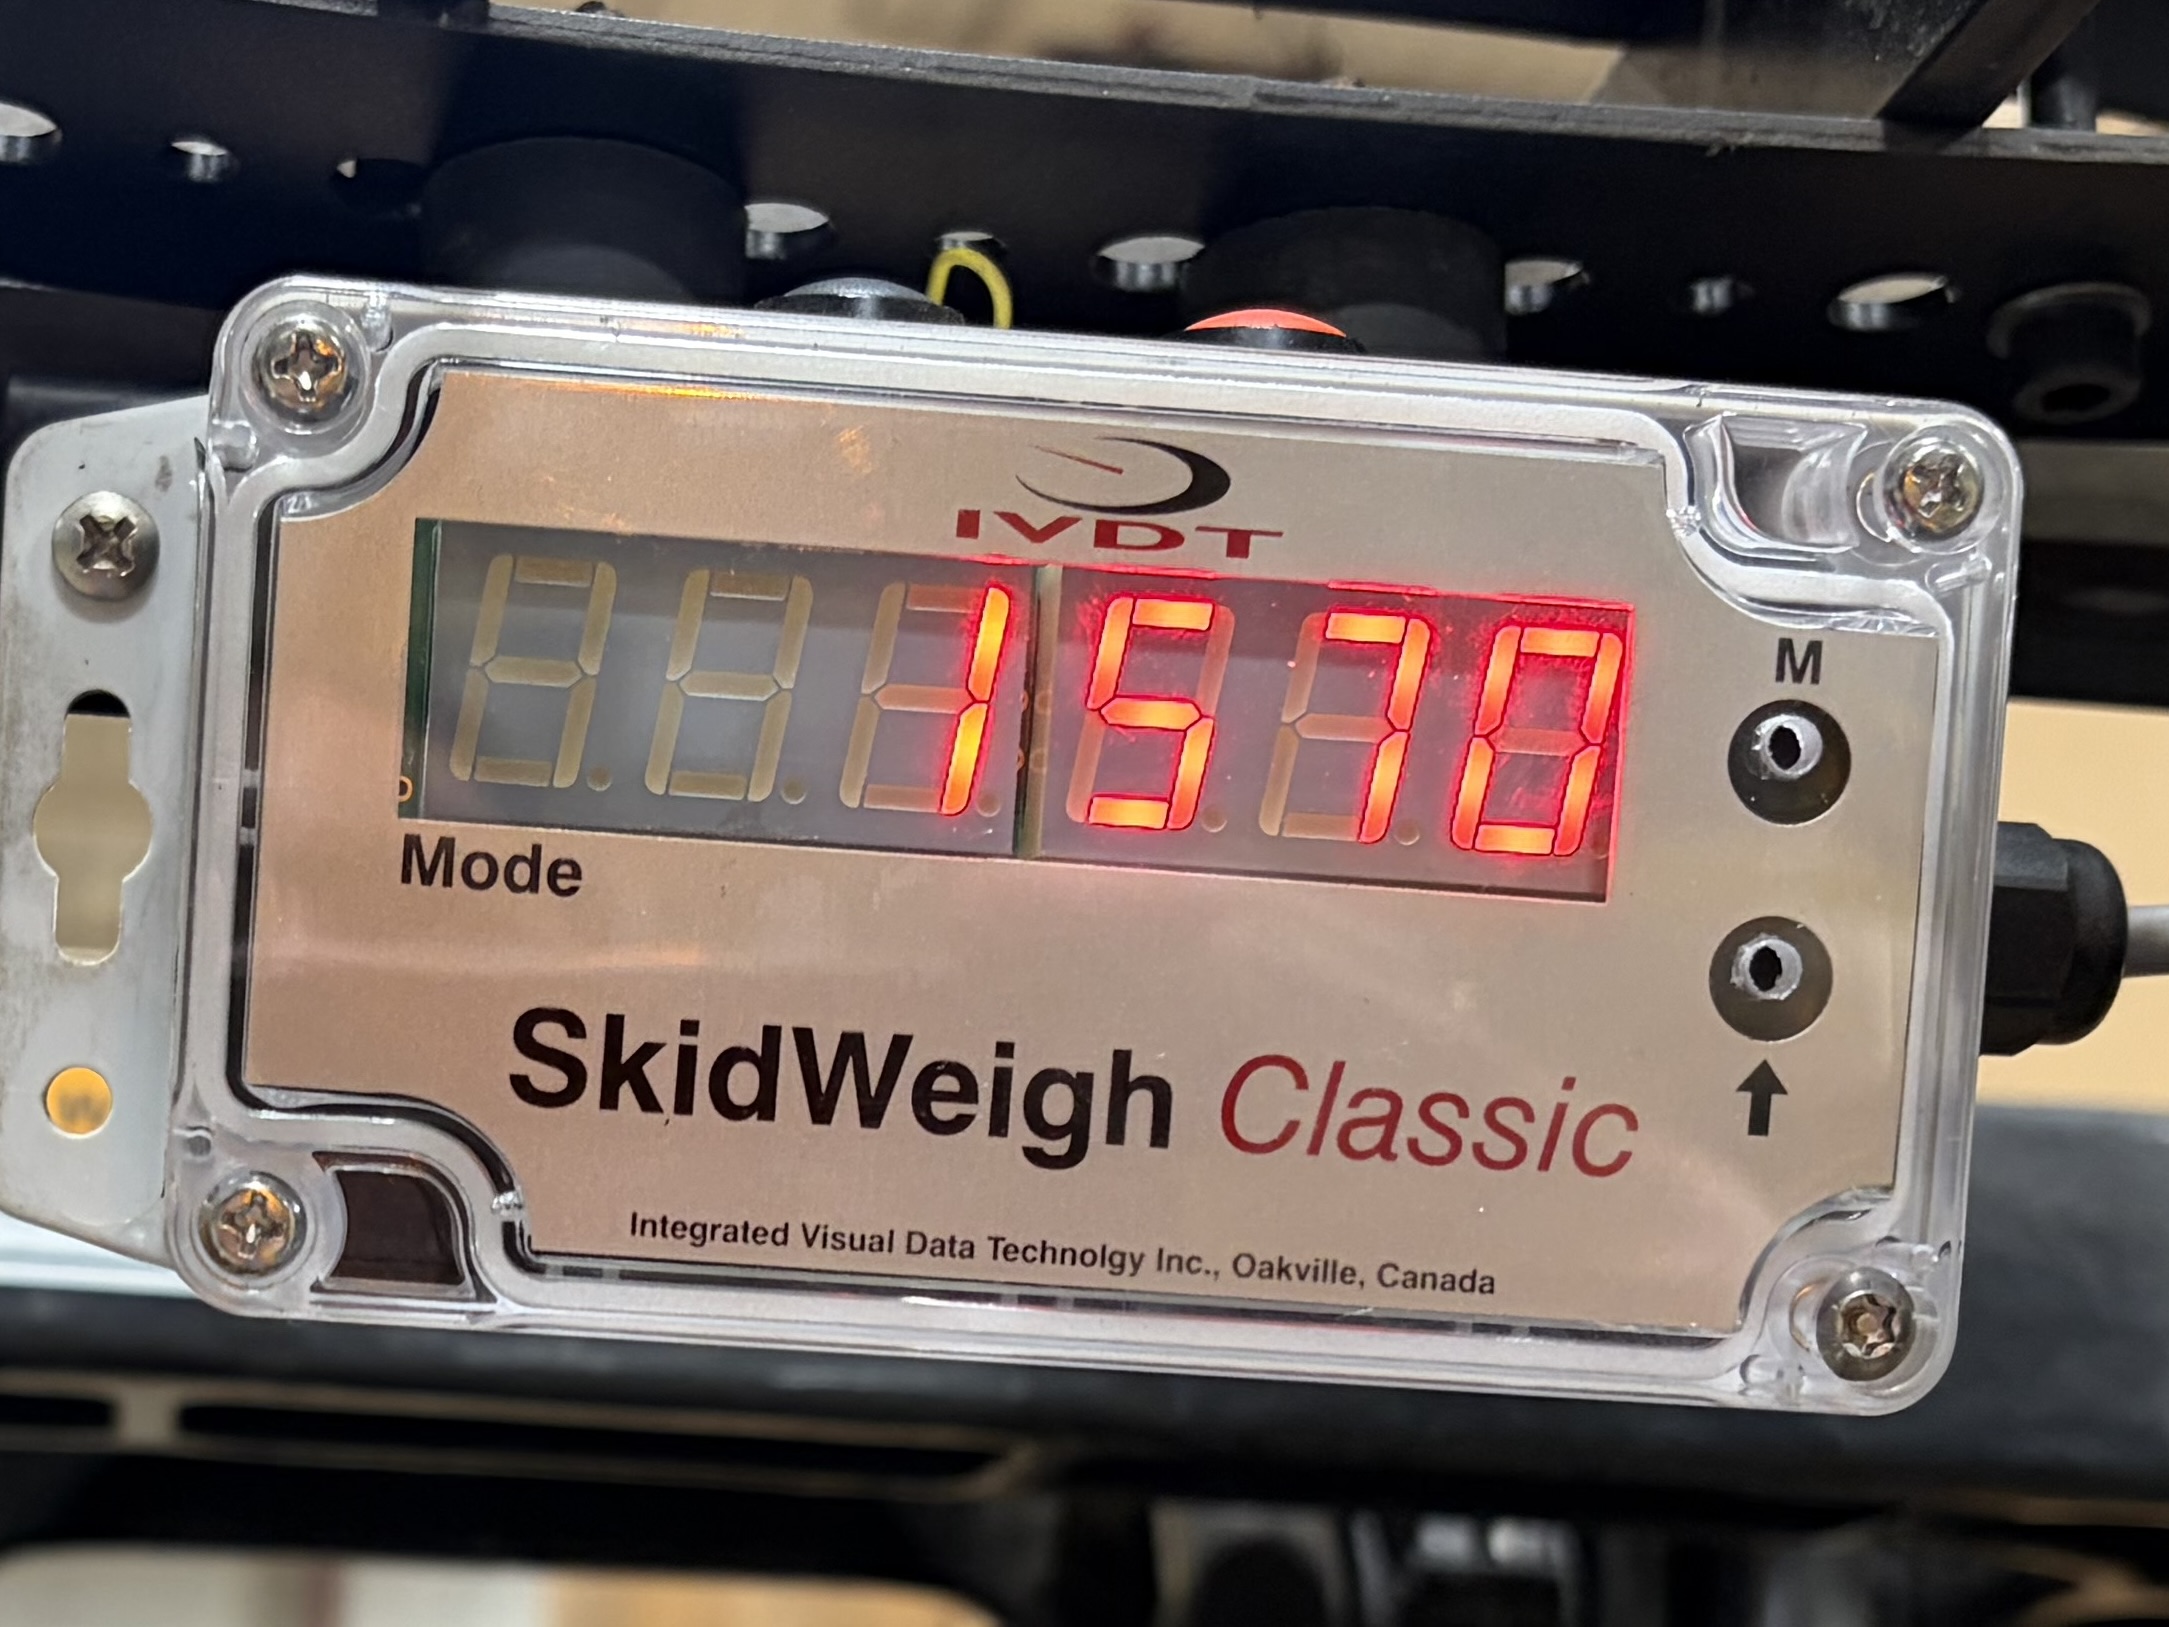
- Note:SkidWeigh weighing scales installed on forklift fleet will detect minor variance of 100 lbs or better.
Financial Impacts of Weight Corrections
When a discrepancy is captured via a terminal's automated systems, it triggers a Weight & Inspection (W&I) certificate.
Operations using SkidWeigh onboard check weighing scales will trigger a Weight & Inspection certificate by moving the load to “Legal for Trade” certified floor scale. With each vehicle equipped with SkidWeigh verification is done faster and covers all inbound freight weight.
Shippers are generally charged with two distinct penalties:
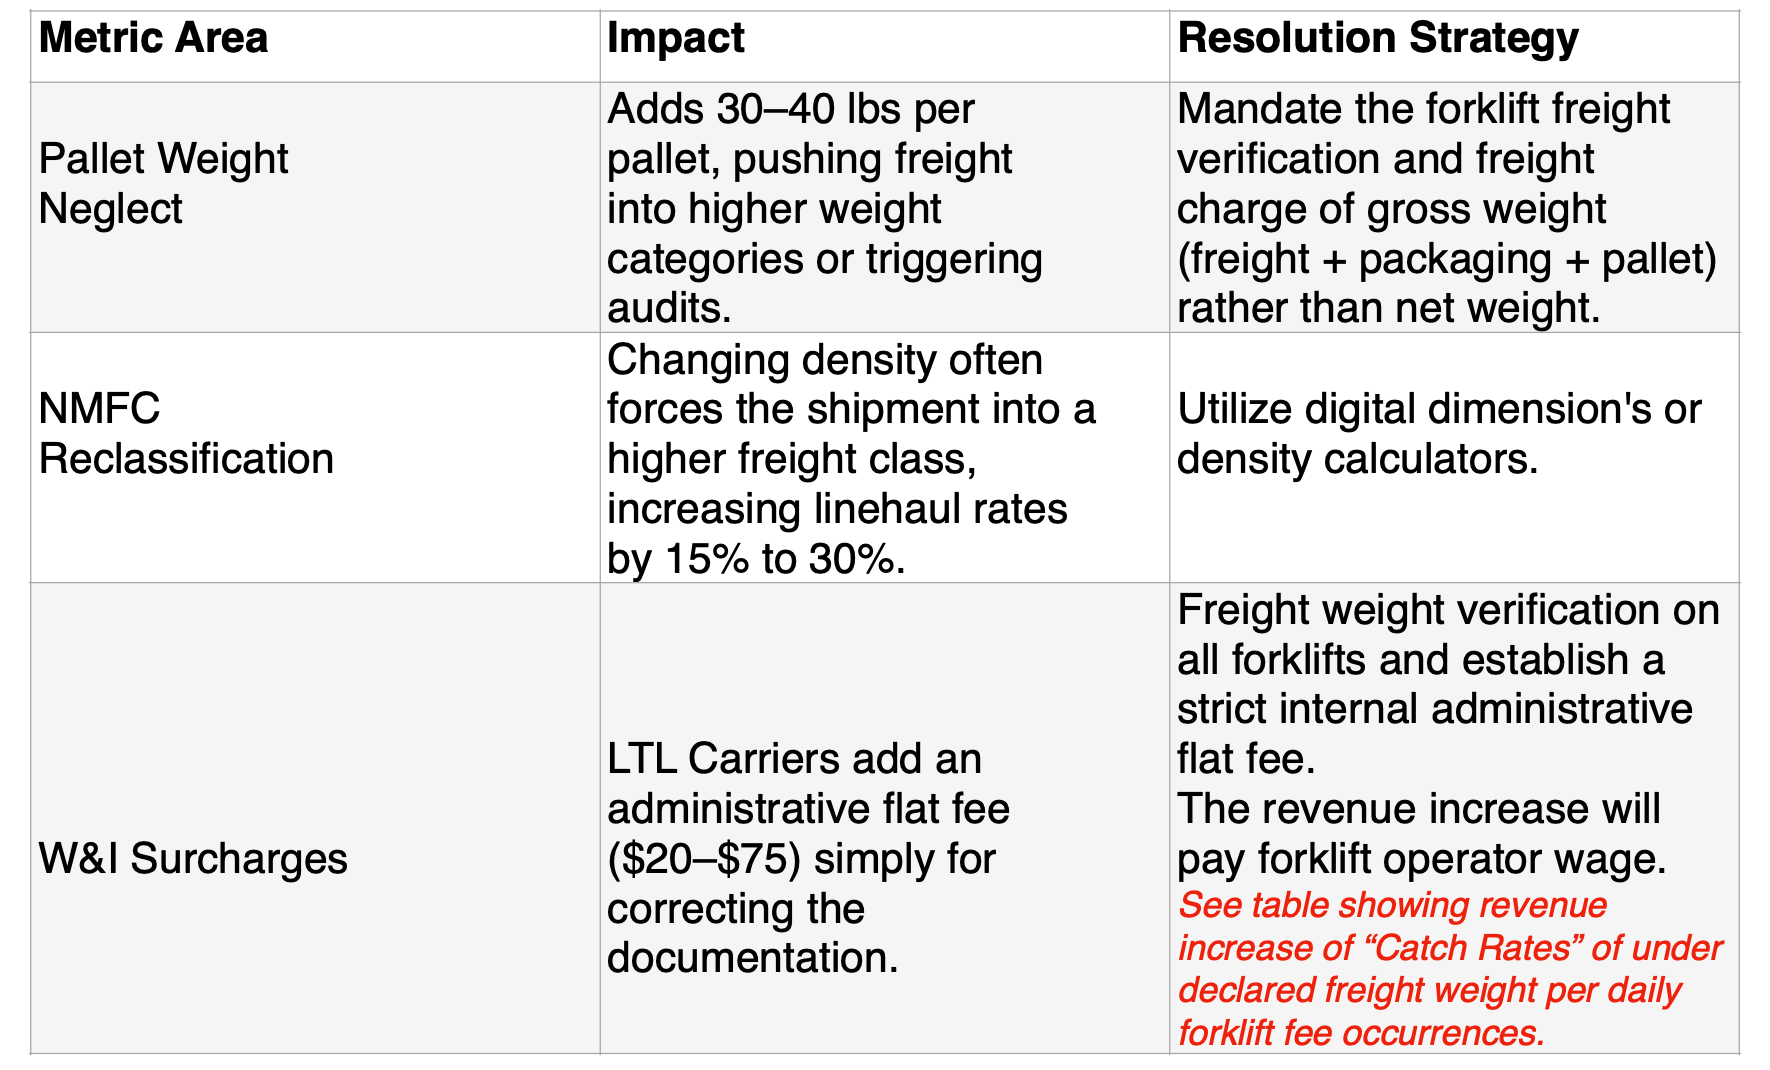
- 1. Administrative Flat Fee: A standard re-weigh/re-class fee ranging between $20 and $75 per occurrence.
- 2 .Density/Class Adjustments: Because a higher weight changes the cargo's calculated density, it frequently pushes the shipment into a costlier National Motor Freight Classification (NMFC) class. This correction adds an average of 15% to 30% over the initial quoted rate, resulting in an average carrier invoice overcharge of $145 per corrected shipment if left unmanaged.
Financial Impacts of Weight Corrections
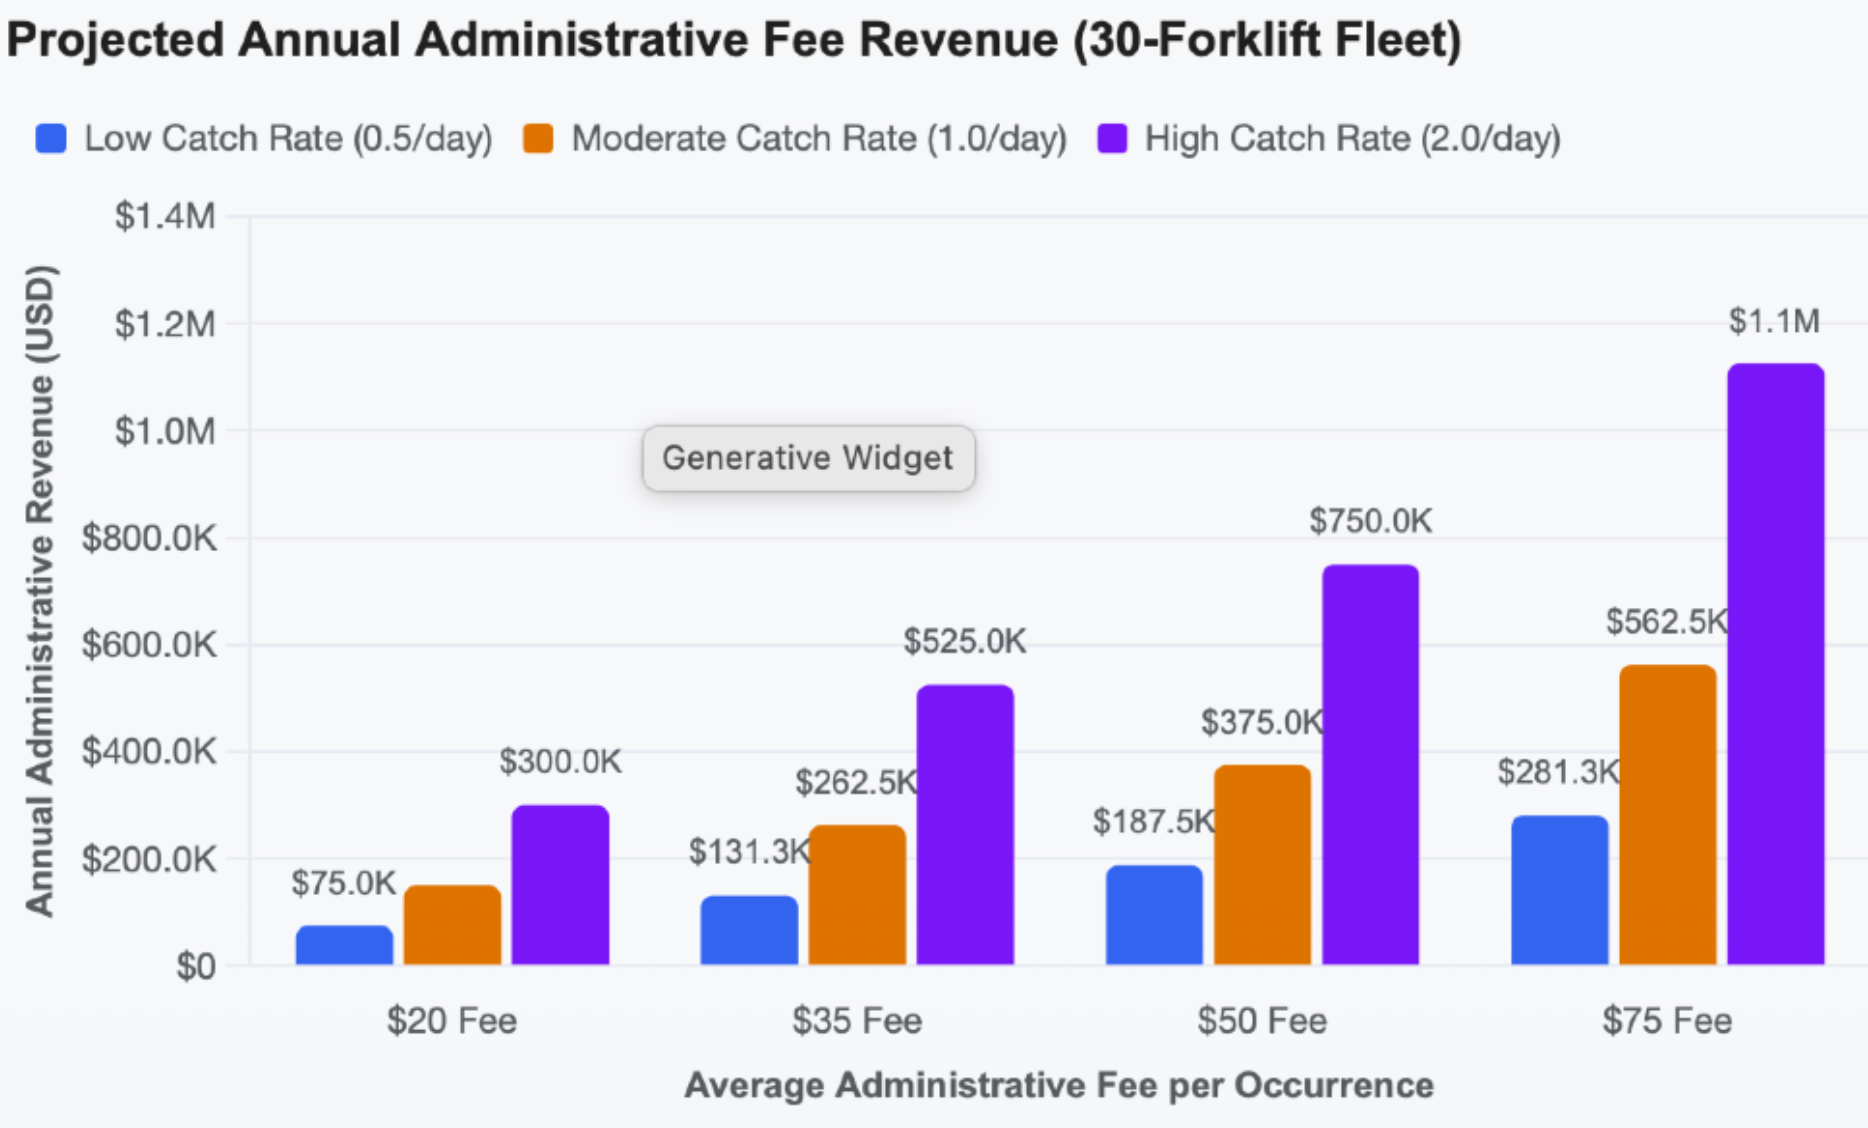
When a carrier equips a fleet of 30 forklifts with mobile onboard scales or automatedterminal dimensioned, capturing under declared weights transforms the administrativeflat fee into a massive, direct revenue stream.
The chart assumes a standard freight environment where the fleet operates 250 days per year. Even minimal detection rates generate substantial recurring capital to offset terminal operational costs.
Annual Revenue Projections by Fleet Performance
The revenue scale depends heavily on two levers: how strictly your terminal monitors freight (catch rate) and the tier of your Weight & Inspection (W&I) administrative fee structure.
- The Baseline (0.5 Corrections/Day): If each forklift driver only flags one discrepant pallet every two days, a fleet of 30 forklifts captures 3,750 errors annually. At a conservative $35 administrative fee, this yields $131,250 in pure administrative revenue, entirely separate from the recovered line haul charges.
- The Industry Standard (1.0 Correction/Day): Capturing just one under- declared shipment per forklift shift results in 7,500 total corrections per year. At a mid-tier $50 fee, the fleet generates $375,000 in administrative billings.
- High-Volume Optimization (2.0 Corrections/Day): In busy multi-shift hubs where forklifts catch two discrepancies per day, the fleet processes 15,000 annual corrections. If your carrier rules support an aggressive $75 fee (common for complex density reclassifications), this single fee stream adds $1,125,000 straight to the bottom line.
 Download Brochure